![]()
![]()
![]()
4.1.1 Farm survey
4.1.2 Station study
4.1.3 Survey preparations
4.1.4 Local cassava varieties
4.1.5 Qualitative analysis of dried cassava chips
4.1.6 Socio-economic study on cassava chip storage
4.1.7 Statistics
As already mentioned in the Introduction, the field studies were undertaken in the Northern Region of Ghana.
Preliminary visits were made to selected possible farm sites that were easily accessible and owned by farmers willing to participate in the survey. A total of 21 farmers were chosen from 12 villages in three districts (see Figure 29), under the guidance of the Regional Post-Harvest Officer, Northern Region. Where possible, farmers were selected from among those who had participated in our general questionnaire in 1994 (MOFA-GTZ, 1994) with the proviso that they anticipated storing dried chips for about six to eight months. The storage structures considered in the survey were those determined to be most popular by this 1994 questionnaire. Towards the end of the study, many farmers had depleted their store of dried chips thus the number of storage structures involved in the trial decreased from 21 in July to 5 in October.
Figure 29: Map of villages participating in Loss-assessment Study
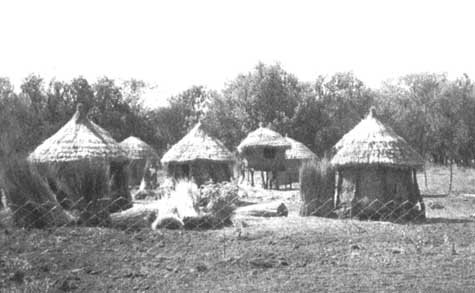
The station trials were setup at the demonstration garden of the Ministry of Agriculture (MOFA), Tamale (see figure 30). The station trials allowed for accurate measurement of amounts of chips. Chips were removed from the stores on a regular basis, which is the typical pattern of consumption used by the farmers. In addition, the trials allowed for investigations under controlled conditions. Parallel to the farm study, the three most popular storage structures (namely the traditional Kanbon, improved Kanbon and the Napogu) were replicated at the station. Sampling, baseline procedure and loss-assessment were conducted in the same manner as for the on-farm survey. Chips may have contained some natural infestation even before being deposited in the storage structures.
Figure 30: On-station trials set-up at the Demonstration Garden of the Ministry of Agriculture
The assessment of weight losses due to insect feeding was carried out in the same way as the study under controlled conditions (see section 3) using the four different loss-assessment methods. Sampling from the selected storage structures was carried out on a four-week basis for about eight months. Insect population dynamics were monitored and insect pests feeding on cassava chips specified. Specimens of interesting species were forwarded to the BBA, Germany for more detailed identification.
Baseline study
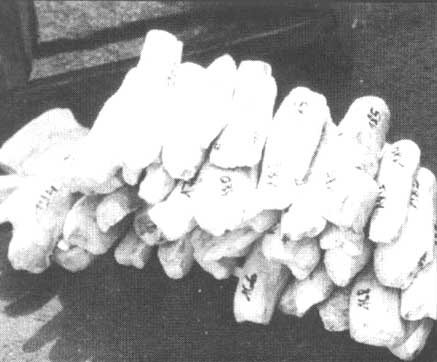
At the beginning of the storage season, a total of 300 dried cassava chips was drawn from all storage structures involved in the trials at the farms and at the station. These chips were assessed with the four different loss-assessment methods. The cassava chips used during the eight-month loss study, as reference samples, were weighed in groups for each structure at the beginning of the survey. Each chip was labelled and analysed for weight and visual damage. The moisture content was determined, and a qualitative assessment of cyanide and starch content was also carried out. Each storage structure, at the farm and at the station then contained about 200 labelled chips, including a proviso of 40 chips in case chips were missing or consumed. The farmers were then asked to mix their stored produce with the labelled chips thoroughly. Each labelled chip retained its identity as to date collected. Farmers were paid in advance for the cassava chips collected during the loss-assessment survey. They were also asked to register the removal of chips from their storage structures and to give an estimation of the entire amount of cassava chips stored at the beginning of the storage season (see Figures 31 and 32).
Very important for a field study is the collection of representative samples of a sufficient size to gain statistically meaningful results. Sampling presented some problems during the field study in the Northern Region of Ghana, and there was the practical problem of gaining access to the interior or lower levels of traditional storage structures. Especially in the field stores, initially only chips from the top layers were sampled. Later samples were taken from lower areas, as farmers had removed some of the stored crop for family use.
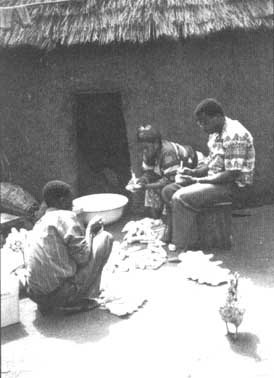
Figure 31: Sampling of cassava chips at a farm-household in Libga, Northern Region of Ghana
Monthly sampling
Chips from 30 farm and station storage structures, were drawn each month, and samples were immediately checked visually on the spot and then sealed in plastic bags for further analysis in the laboratory. The samples of 20 dried chips weighed approximately 1200 - 2400 g. Every sample was analysed for moisture content, weight, inner and outer volume, visual damage, and number and species of insects. Weight losses were corrected for moisture content changes. Chips were separated into four categories: undamaged, insect damage, mould damage and rodent damage. During the monthly visits, the storage structures and the stored produce were carefully checked and notes were taken on the laboratory sheets. The analysis of weight losses of dried chips was performed in the same manner as under controlled conditions, so that the costs, quality and precision of the methods could be compared (see section 3).
Figure 32: Labelled chips for on-farm study in Libga, Northern Region of Ghana
There are no generally accepted names for each and every local cassava variety of which a total of 78 are known in Ghana (Annor-Frempong, 1991). On the basis of their specific characteristics, the local cassava varieties are given local names by the farmers. For instance, Busum-nsia literally means "six months". The most popular varieties in the Northern Region are Busum-nsia, Bulu-djia and Nag-baani (sweet varieties), followed by Jagboo Bazhi, Belgora, Bogo, Kalaba, Ndame (bitter varieties) and Pagzhi (sweet variety) (MOFA-GTZ, 1994). The storage structures in the Demonstration Garden at the station in Tamale held a mix of different varieties, due to the fact that it was not possible to purchase only one variety from the farmers. A mix of six varieties was stored in each of the nine station structures: Bulu-djia, Busum-nsia, Nag-baani, Bogo, Pagzhi and Yoruba; whereas in the farm trials generally only one or two varieties were stored.
Cassava chips were chemically analysed for HCN and starch content; samples of 100 g cassava flour, sealed in airtight plastic bags, were sent for nutritional analysis to ECO SYS (see section 3.1.4) in Germany.
The moisture content (m. c.) of cassava chips was assessed every four weeks for each sample and structure. Chips were pounded on the spot at each farm and the flour was placed in glass jars. The sealed jars were kept in cool boxes until analysis took place in the laboratory on the same day. The samples were analysed in three replicates of 10 g cassava flour. The flour was weighed in petri dishes and dried for about two hours in an ordinary kitchen oven at 120° C. It was not possible to use any sophisticated moisture content equipment because tests with moisture meters intended for maize or other grain flour did not provide reliable results for cassava.
A general survey (Mofa-GTZ, 1994) carried out before the loss-assessment study was intended to facilitate post-harvest information gathering as well as field work planning. Questionnaires were pre-tested and modified according to the suggestions of farmers groups, extension staff and GTZ staff. The questionnaire included both a standardised form and open-ended questions encouraging more detailed response from the farmers. After pre-testing the draft, the questionnaire was administered to 150 farm households in the vicinity of the three districts in the Northern Region in order to obtain basic data on the farm-household environment and, especially, on storage systems of cassava. The sample size and area of choice were selected on the basis of logistics, personnel and financial limits. To overcome the language barrier, questions were translated into the common languages with the assistance of enumerators (see Appendix I). The main areas highlighted were:
- demographic characteristics of the farm household
- agricultural area and production
- cultivation characteristics of cassava
- post-harvest management of dried cassava chips
- storage problems
- gender issues related to processing, harvesting and storage of cassava
- economic assessment of storage of dried cassava chips.
About 50 farmers in five villages were selected for further questioning on losses perceived during storage of cassava chips. In each of the villages, groups of farmers were gathered for a discussion about their perception of losses when storing dried cassava chips. The farmers were asked to estimate the magnitude of post-harvest losses.
The farmers involved in the farm loss-assessment study (21 individuals in 15 villages in three districts) were asked to discuss the seasonal nature of production, storage and marketing of cassava. Each farmer was individually interviewed on:
- gender issues
- general farm-household problems
- advantages and disadvantages of cassava farming
- future possibilities of cassava farming
- estimate of chip storage costs
- marketing issues.
A price study supported an economic assessment of cassava-chip storage and monetary evaluation of weight losses. Farmgate (producer) prices were recorded every four weeks at the farms. Retail and wholesale prices were gathered in two market locations - in Tamale and Nyankpala - on a two-week basis. The main market in Tamale is located at the town centre, and the wholesale and retail selling of many agricultural products are conducted on a weekly basis. Unfortunately, our price study exercise was useful only during the first months of cassava chip storage and when plenty of it was traded, but less reliable towards the end of the storage season due to the reduced number of transactions as many farmers had exhausted their cassava stores. Secondary data on climate, production figures and trends were obtained from PPMED, the Meteorological office, MOFA and private individuals in Tamale. They assisted on a regional and national level. Data on interest rates and foreign exchange rates were collected from Barclays Bank in Tamale (see Appendix II). Monthly information on consumer prices was mainly based on the fluctuation of the beer prices provided by the General Manager of the Guinness Company, Northern Region, Tamale.
The data were analysed using SAS computer programs. Means of weight losses assessed with different methods were compared with a 2-tailed t-test (Dunnett) and for a confidence level of 95%. Data input and analysis for the questionnaires were done with the "Epi Info Version 5", a word processing, database and statistical system for epidemiology, on microcomputers provided by the GTZ Health Project in Tamale.
4.2.1 Farm and station study
4.2.2 Relationship of different methods to boreholes
4.2.3 Comparison of four different loss-assessment methods
4.2.4 Causes of losses
4.2.5 Cumulative weight loss
4.2.6 Qualitative analysis of cassava chips
4.2.7 Economic study of cassava chip storage
As in the trials under controlled conditions in Berlin, the weight losses assessed by the GM, MM and VGM increased with the length of storage period for both the farm and station studies. The MM loss curve correlated closely with the GM loss curve, whereas the VGM curve varied in comparison to the MM and GM for both studies (see Figures 33 and 34).
Figure 33: Development of weight losses (%) assessed with 3 different methods during 8 months of storage period, farm study 1995 (n = 2460 chips)
Figure 34: Development of weight losses % assessed with 3 different methods during 8 months storage period, station study 1995 (n = 1223 chips)
As in the experiments under controlled conditions (see section 3), the GM was used as a reference method and the VGM and MM were compared against it. The VGM provided relative weight loss-assessments which were significantly different from those of the reference method for the entire storage period and for both studies except in the first month of storage. Weight losses over the storage period were frequently over- or underestimated. At the beginning of the storage phase, the VGM estimated small losses without any visible infestation of the dried cassava chips. This method significantly underestimated weight losses for the four-month storage during the station study (see Tables 13 and 14).
Table 13: Comparison of weight losses (%) assessed with the GM and VGM, 8-month storage period farm study, 1995 (n = 2460 chips)
|
months in storage |
number of stores (n) |
GM |
VGM |
t-test |
||
|
mean in % |
sd |
mean in % |
sd |
|||
|
0 |
21 |
0 |
0 |
0.2 |
11.2 |
n.s. |
|
1 |
21 |
0 |
0.1 |
0.6 |
10.9 |
n.s. |
|
2 |
21 |
0.2 |
0.7 |
2.0 |
7.7 |
s |
|
3 |
21 |
0.9 |
2.2 |
2.5 |
8.2 |
s |
|
4 |
21 |
1.9 |
3.3 |
0.9 |
8.8 |
s |
|
5 |
21 |
3.7 |
4.1 |
0.8 |
7.9 |
s |
|
6 |
19 |
4.6 |
4.3 |
0.6 |
8.3 |
s |
|
7 |
16 |
7.3 |
7.1 |
3.2 |
8.2 |
s |
|
8 |
5 |
8.0 |
8.0 |
- |
- |
- |
p = 0.05; n.s. = not significant; - = no valid pairs existing, s = significant
Table 14: Comparison of weight losses % assessed with the GM and VGM, 8-month storage period station study, 1995 (n = 1223 chips)
|
months in storage |
number of stores (n) |
GM |
VGM |
t-test |
||
|
mean in % |
sd |
mean in % |
sd |
|||
|
0 |
9 |
0.0 |
0.0 |
3.8 |
8.9 |
s |
|
1 |
9 |
0.0 |
0.0 |
0.6 |
11.1 |
n.s. |
|
2 |
9 |
0.3 |
1.3 |
4.8 |
9.5 |
s |
|
3 |
9 |
0.8 |
1.3 |
3.3 |
10.6 |
s |
|
4 |
9 |
1.8 |
2.2 |
-0.8 |
6.7 |
s |
|
5 |
9 |
4.7 |
5.5 |
0.6 |
10.0 |
s |
|
6 |
9 |
6.5 |
6.1 |
2.5 |
7.9 |
s |
|
7 |
9 |
13.6 |
10.1 |
2.8 |
10.3 |
s |
|
8 |
9 |
21.3 |
15.1 |
- |
- |
- |
p = 0.05; n.s. = not significant; - = no valid pairs existing, s = significant
The MM, like the VGM, returned small weight losses for chips without visible damage at the beginning of the storage. This is related to the non-usage of baseline data. The weight losses estimated by the MM varied significantly from the GM only during the last two months of storage and for the station study. Overall, the method is very similar to the reference method in assessing weight losses (see Tables 15 and 16).
Table 15: Comparison of weight losses (%) assessed with the GM and MM, 8-month storage period, farm study, 1995 (n = 2460 chips)
|
months in storage |
number of stores (n) |
GM |
VGM |
t-test |
||
|
mean in % |
sd |
mean in % |
sd |
|||
|
0 |
21 |
0 |
0 |
0 |
0.1 |
n.s. |
|
1 |
21 |
0 |
0.1 |
0 |
0.2 |
n.s. |
|
2 |
21 |
0.2 |
0.7 |
0.3 |
0.9 |
n.s. |
|
3 |
21 |
0.9 |
2.2 |
1.3 |
2.7 |
n.s. |
|
4 |
21 |
1.9 |
3.3 |
2.5 |
3.7 |
n.s. |
|
5 |
21 |
3.7 |
4.1 |
3.0 |
4.0 |
n.s. |
|
6 |
19 |
4.6 |
4.3 |
5.4 |
4.2 |
n.s. |
|
7 |
16 |
7.3 |
7.1 |
7.3 |
5.3 |
n.s. |
|
8 |
5 |
8.0 |
8.0 |
8.4 |
7.4 |
n.s. |
p = 0.05; n.s. = not significant; - = no valid pairs existing; s = significant
Table 16: Comparison of weight losses % assessed with the GM and MM, 8-month storage period, station study (n = 1223 chips)
|
months in storage |
number of stores (n) |
GM |
VGM |
t-test |
||
|
mean in % |
sd |
mean in % |
sd |
|||
|
0 |
9 |
0 |
0 |
0.0 |
0.0 |
n.s. |
|
1 |
9 |
0 |
0 |
0.0 |
0.0 |
n.s. |
|
2 |
9 |
0.3 |
1.3 |
0.3 |
1.3 |
n.s. |
|
3 |
9 |
0.8 |
1.3 |
1.0 |
1.4 |
n.s. |
|
4 |
9 |
1.8 |
2.2 |
2.5 |
3.1 |
n.s. |
|
5 |
9 |
4.7 |
5.5 |
4.6 |
3.9 |
n.s. |
|
6 |
9 |
6.5 |
6.1 |
6.0 |
4.5 |
n.s. |
|
7 |
9 |
13.6 |
10.1 |
10.3 |
5.2 |
s |
|
8 |
9 |
21.3 |
15.1 |
14.3 |
6.8 |
s |
p = 0,05; n.s. = not significant; - = no valid pairs existing, s = significant
The most suitable methods for investigating relationships of two variables are correlations and regressions. The relationship or degree of association of the two variables is expressed as a coefficient of correlation. Plotting the results gained with different methods against the GM resulted in relationships which were different from r = 1. A linear regression was used to relate the results gained with the GM to figures assessed with other loss-assessment methods. The relationship was not a perfect straight line, but the comparison of the GM and MM values showed a positive correlation for the farm and station studies with r = 0.9 (see Figures 35 and 36). Moreover, the gradients are nearly the same, at about 0.9 to 1.1. The same applies for the trial under controlled conditions and a gradient of about 0.9 for weight losses assessed with the MM and GM.
Figure 35: Relationship of losses assessed by GM and MM, farm study 1995, 8-month storage period (n = 2460 chips)
Figure 36: Relationship of losses assessed by GM and MM, station study 1995, 8-month storage period (n = 1223 chips)
The slopes of the VGM for both studies contrast with these values, with a figure of 0.04. Values assessed by the VGM compared to the GM gave a coefficient of correlation of r = 0.08 for the farm trials and r = 0.05 for the station trials (see Figures 37 and 38). This is in contrast to the trial under controlled conditions with a correlation coefficient of r = 0.5.
Figure 37: Relationship of losses assessed by GM and VGM, farm study 1995, 8-month storage period (n = 2460 chips)
Figure 38: Relationship of losses assessed by GM and VGM, station study 1995, 8-month storage period (n = 1223 chips)
With a longer period of storage, the weight losses assessed by the different methods increased and greater numbers of boreholes were ascertained in both the station and farm studies. The relationship of the different loss-assessment methods to boreholes on dried chips was not a straight line, but the probability for an individual value to be within the 95% confidence limits was r = 0.9 for both the farm and station studies assessed with the GM (see Figures 39 and 40). The slope of the curves in both studies are similar at 0.08 to 0.09. These results are in line with those of the trial under controlled conditions at r = 0.9 and a gradient of about 0.1.
Figure 39: Relationship between losses assessed by the GM and number of boreholes on chips, farm study 1995, 8-month storage period (n = 2460 chips),
Figure 40: Relationship between losses assessed by the GM and number of boreholes on chips, station study 1995, 8-month storage period (n = 1223 chips)
The relationship between weight losses assessed with the MM and boreholes was close, with about r = 0.9 for both the farm and station studies (see Figures 41 and 42). The slope of the regression function for the MM is about 0.8 in both studies, identical to the trials of the GM and boreholes.
Figure 41: Relationship between losses assessed by the MM and number of boreholes on chips, farm study 1995, 8-month storage period (n = 2460 chips),
Figure 42: Relationship between losses assessed by the MM and number of boreholes on chips, station study 1995, 8-month storage period (n = 1223 chips)
The relationship between weight losses assessed by the VGM and boreholes was in comparison not very close, and the probability for an individual value to be within the 95% confidence limits was r = 0.04 for the farm study and r = - 0.01 for the station study (see Figures 43 and 44). The slope of both functions are, at 0.008 on the farm and - 0.002 at the station, different from the slopes of the GM and MM. The trial under controlled conditions measured a relationship of 0.4 between VGM and boreholes.
Figure 43: Relationship between losses assessed by the VGM and number of boreholes on chips, farm study 1995, 8-month storage period (n = 2460 chips),

Figure 44: Relationship between losses assessed by the VGM and number of boreholes on chips, station study 1995, 8-month storage period (n = 1223 chips),

Visual Damage Scale Method (VDSM)
The majority of dried chips for both the farm and station studies were visually classified in damage scales I to III, with some chips classified in scale IV or V. The calibrated visual damage classes were found to correspond to a broad ranges of average weight losses, especially for scale IV and V estimated for the station study (see Tables 17 and 18). The damage scales for both studies were calibrated with the three conventional loss-assessment methods and the following weight loss ranges were calculated:
farm study (see Table 17)
I = 0 -1.5%, II = 1.0 - 3.6%, III = 2.0 - 11.7%, IV = 6.0 -16.4%, V = -3.3 - 26.7%
station study (see Table 18)
I=0-3.7%, II = 1.0-3.5%, III = 2.2-13.2%, IV = 5.2-23.6%, V=1.0-40.4%.
Table 17: VDSM calibrated with 3 loss-assessment methods farm study 1995, 8-month storage period (n = 2460 chips),
|
|
VDSM |
||||
|
I |
II |
III |
IV |
V |
|
|
sample size (n) |
911 |
1238 |
264 |
33 |
14 |
|
GM in % |
0 |
2.7 |
11.2 |
16.4 |
26.7 |
|
sd |
0 |
2.7 |
3.9 |
8.6 |
13.6 |
|
VGM in % |
1.5 |
1.0 |
2.0 |
6.0 |
-3.3 |
|
sd |
9.6 |
8.0 |
10.3 |
9.8 |
6.7 |
|
MM in % |
0.0 |
3.6 |
11.7 |
13.6 |
8.5 |
|
sd |
0.3 |
3.0 |
4.2 |
5.2 |
7.4 |
Table 18: VDSM calibrated with 3 loss-assessment methods station study 1995, 8-month storage period (n = 1223 chips),
|
|
VDSM |
||||
|
I |
II |
III |
IV |
V |
|
|
sample size (n) |
300 |
591 |
201 |
89 |
42 |
|
GM in % |
0 |
2.9 |
13.2 |
23.6 |
40.4 |
|
sd |
0 |
2.6 |
5.1 |
10.0 |
14.2 |
|
VGM in % |
3.7 |
1.0 |
2.2 |
5.2 |
1.0 |
|
sd |
9.7 |
9.1 |
10.8 |
10.5 |
3.2 |
|
MM in % |
0.0 |
3.5 |
12.4 |
16.7 |
- |
|
sd |
0.0 |
3.0 |
4.8 |
6.4 |
- |
- no data available
Distinguishing boreholes on dried chips was only possible for the damage scales I to III. Chips classified in scales IV and V were physically destroyed. The mean number of boreholes during the farm loss-assessment study increased from 0 to 68 boreholes during eight months of storage, whereas the mean number of boreholes during the station study increased in the same storage period from 0 to 135 boreholes (see Tables 19 and 20).
Table 19: VDSM estimated using the mean number of boreholes per chip during an 8-month storage period farm study (n = 2460 chips)
|
Months after storage |
Mean number of boreholes per sample |
VDSM |
|
|
mean |
sd |
mean |
|
|
0 |
0 |
0 |
I |
|
1 |
0.2 |
0.8 |
I |
|
2 |
2 |
8.3 |
I |
|
3 |
11 |
30.5 |
I-II |
|
4 |
19 |
31.2 |
II |
|
5 |
37 |
44.3 |
II |
|
6 |
49 |
45.7 |
II |
|
7 |
67 |
60.1 |
II-III |
|
8 |
68 |
56.4 |
II-III |
Table 20: VDSM estimated using the mean number of boreholes per chip during a 8-month storage period station study (n = 1223 chips)
|
Months after storage |
Mean number of boreholes per sample |
VDSM |
|
|
mean |
sd |
mean |
|
|
0 |
0 |
0 |
I |
|
1 |
0 |
0 |
I |
|
2 |
2 |
11.6 |
I |
|
3 |
10 |
15.5 |
II |
|
4 |
25 |
28.9 |
II |
|
5 |
47 |
38.5 |
II |
|
6 |
63 |
47.5 |
II-III |
|
7 |
107 |
70.8 |
III |
|
8 |
135 |
73.8 |
III |
Comparison of the results assessed or estimated with GM, VGM, MM and VDSM during the station- and farm loss-assessment studies was made according to certain criteria and compiled in chart form (see Table 21). The grading of the four loss-assessment methods was also carried out under controlled conditions in Berlin. The estimations in Ghana were slightly revised compared to the estimations under controlled conditions, mainly for the VGM and VDSM (see Table 12 in section 3).
Table 21: Comparison of 4 different loss-assessment methods according to certain criteria
|
Criteria |
loss-assessment methods |
|||
|
GM |
VGM |
MM |
VDSM |
|
|
Suitability |
*** |
** |
**** |
** |
|
Apparatus and costs |
*** |
** |
*** |
**** |
|
Field practicability |
*** |
* |
**** |
*** |
**** = very good, *** = good, ** = suitable, * = less suitable
Suitability
The four methods assessed weight losses of dried chips over an eight-month storage period differently (see Table 21). Loss figures assessed by the GM and MM were closely related throughout the farm study and up to the sixth month of the station study. Both methods measured values for weight losses in the range of 0 - 8.4% for the farm storage but differed for the station study, where the GM assessed higher losses of between 0 and 21.3%, compared to the MM loss-assessments of between 0.01 and 14.3%. This is probably due to the fact that station samples suffered from the migration of pests from a nearby maize storage structure, and also that MM is only able to asses losses on chips which are not severely damaged. The assessment of weight losses by the VGM either over- or underestimated the losses compared to the GM and MM. Weight losses assessed were between 0.7 to 3.2% for the farm study and between 0.6 to 3.8% for the station study. This trend of weight loss results for the GM, VGM and MM methods is in line with that of trials under controlled conditions, when the GM and MM assessed losses quite similarly, whereas the VGM in comparison over- or underestimated weight losses over the storage period of 12 weeks.
The VDSM produced estimates of weight losses for each damage scale, and with this method the quality of the mean loss figures depends very much on the quantitative method chosen for calibration. The estimations of weight losses for scales I = 0 - 1.5%, II = 1.0 -3.6%, III = 2.0 - 11.7% on the farm were nearly the same as weight losses estimated for scales I = 0 - 3.7%, II = 1.0 - 3.5%, III = 2.2 -13.2% at the station. The estimates for scales IV = 6.0 -16.4% and V = - 3.3-26.7% on the farm were different from the weight losses estimated for scales IV = 5.2 - 23.6% and V = 1.0 - 40.4% at the station. Moreover, the number of boreholes calculated for each chip differed between the farm study with 68 boreholes and the station study with 138 boreholes after eight weeks of storage.
During the trials under controlled conditions, the weight losses estimated in experiments with chips exposed to single and mixed insect infestation were for scale I from 0 - 0.4%, for scale II from 1.8 - 4.0%, for scale III from 4.2 - 15.0%, for scale IV 36.5% and for scale V 59.3%. The much higher weight loss estimates for the different scales under controlled conditions compared to in the field studies in Ghana were due to much higher start population densities of insects and insect infestation with P. truncatus. As in the trials under controlled conditions, the GM, VGM and MM produced objectively verifiable loss figures which could be used to compare post-harvest losses of stored chips from different areas or regions (see Table 21). But reliable results with the GM will only be obtained when a baseline sample can be collected at the beginning of the season. In contrast, the VDSM only gave estimates of weight losses by classifying chips into various scales. The MM, VGM and VDSM produce results without referring to baseline data. In addition, the MM and VGM are only able to assess weight losses on cassava chips that are still firm. Chips which start crumbling are not measurable because they dissipate in water.
Apparatus and costs
The usage of apparatus is costly in developing countries but necessary for assessing post-harvest weight losses with the GM, VGM and MM (see table 21). The technical methods require a scale, a measurement beaker and a device to determine the moisture content. The assessment of losses with the MM requires a vacuum apparatus with a small power-driven engine. Estimation of losses with the VDSM requires good photographs or drawings of the different damage scales and, if available, a simple inexpensive device for assessing holes/cm2 or randomly selecting portions of the chips surface. For calibrating each VDSM by means of a conventional method, the costs for equipment and labour have to be added (see Table 21).
Field practicability
The choice of methods in the field depends on the objective of a study, level of accuracy desired, and funds available. During the 1995 loss-assessment study, it was obvious that two methods - GM and MM - are able to produce good results (see Table 21). Time-consuming and labour-intensive methods are valid for in-country studies or where new projects are involved. Operation of technical equipment requires trained and experienced staff; therefore, such methods are more useful to researchers than to farmers for precise measurement. Conversely, the VGM was finally judged to be the least reliable method related to its difficulties during the studies measuring weight losses (see Table 21). For on-the-spot measurements, the MM and VDSM are useful techniques and very effective. The great advantage of the VDSM is that it is simple to operate and can be used by a wide range of target groups, even by farmers or traders with no special skills in this area.
Sound loss-assessment methods for the accurate estimation of post-harvest losses are essential for governments, private and public institutions as well as industry to secure reliable information on which to base long-term planning of agricultural programmes and allocation of resources (Schulten, 1988).
The knowledge of the range of post-harvest weight losses during storage of dried chips enables researchers, extension services, and producers to outline possible strategies to improve storage techniques and to calculate thresholds for protective measurements. It should be taken into consideration, however, that a simple weight loss figure will not always reflect the importance of a loss in any given situation; thus, it is necessary to consider other factors such as perceptions of farmers, qualitative aspects or the socio-economic environment of the farm-household. These aspects of post-harvest losses are outlined in the following sections.
Investigations were also carried out for the relationships of insect, mould and rodent damage-to-weight losses for both farm and station studies (see Figures 45 and 46). Tables 22 and 23 show that the insect damage was the main cause of weight loss and the rodent- and mould-damaged chips were few in comparison. The insect-damaged chips increased dramatically with the third month of storage, when they constituted about 46% on the farm and 58% at the station, and increased to about 86% for both studies of the total quantity of sampled chips by the end of the storage period. In all cases, the cassava chips were not only damaged by insects but also by micro-organisms or rodents. The relationship between insect damage and weight loss % was quite close during the farm study at r = 0.9 but for the station study at only r = 0.6.
Losses caused by moulds are generally not high in the study area. The responsible organisms are Aspergillus spp., Penicillium spp. and Rhizopus spp. (McFarlane, 1982). Farmers told us that in most years moulds are not a problem, although erratic rainfall could cause drying problems and enhance mould growth. During the loss-assessment study of 1995, a year with intensive rainfall, the mould problem was acute. We found mould on many cassava chip samples, but the farmers were not really concerned. On the contrary, farmers seem to prefer slightly mould-infested chips because of their taste and some re-dry chips before consumption. The mould-damaged chips reached a maximum of about 15% in the farm study and about 33.6% in the station study.
Table 22: Damages % due to insects, micro-organisms and rodents and related to weight losses during the farm study 1995, 8-month storage period (n = 2460 chips)
|
months in storage |
weight loss in % |
Damage in % caused by |
||
|
insects |
micro-organisms |
rodents |
||
|
0 |
0 |
0 |
0 |
0 |
|
1 |
0.0 |
4.6 |
0 |
1.4 |
|
2 |
0.2 |
21.7 |
4.4 |
0.9 |
|
3 |
0.9 |
45.9 |
4.8 |
1.3 |
|
4 |
1.9 |
58.4 |
9.8 |
1.9 |
|
5 |
3.7 |
67.9 |
15.0 |
2.1 |
|
6 |
4.6 |
76.0 |
12.0 |
3.0 |
|
7 |
7.3 |
86.7 |
8.5 |
2.8 |
|
8 |
8.0 |
85.0 |
10.0 |
5.0 |
Table 23: Damages % due to insects, micro-organisms and rodents and related to weight losses during the station study 1995, 8-month storage period (n = 1223 chips)
|
months in storage |
weight loss in % |
Damage in % caused by |
||
|
insects |
micro-organisms |
rodents |
||
|
0 |
0 |
0 |
0 |
0 |
|
1 |
0 |
0 |
0 |
0 |
|
2 |
0.3 |
22.7 |
0 |
3.3 |
|
3 |
0.8 |
58.3 |
17.0 |
0.7 |
|
4 |
1.8 |
75.0 |
15.0 |
0 |
|
5 |
4.7 |
78.0 |
21.0 |
0 |
|
6 |
6.5 |
64.3 |
33.6 |
1.1 |
|
7 |
13.6 |
82.2 |
16.1 |
1.7 |
|
8 |
21.3 |
86.2 |
11.3 |
2.5 |
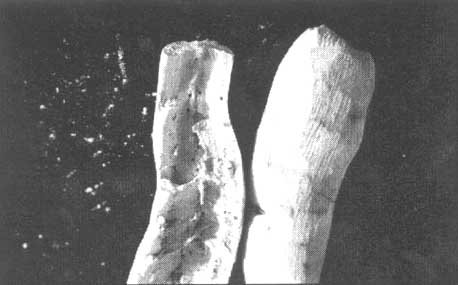
Figure 45: Insect-damaged cassava chips, farm study, Northern Region of Ghana
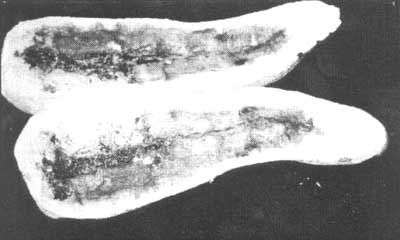
Figure 46: Mould-damaged cassava chips station study, Northern Region of Ghana
Rodent attack was a negligible problem throughout the whole survey, and the rodent-attacked chips constituted a maximum of 5% of the total amount of sampled chips on the farm and 3.3% at the station. In Table 22, where visually damaged chips are related to weight loss over the eight-month storage period on the farm, and chips damaged by insects account for the highest percentage of visual damage. Likewise in the station study (see Table 23), insects are responsible for the highest visual damage to cassava chips. In addition, mould-infested chips account for nearly 34% of the damage in the sixth months of storage.
Insect pests are the most severe constraint to cassava chip storage in Ghana because tropical conditions generally favour the rapid development of insects that attack stored produce. A number of different species of insects were encountered during the loss-assessment study, most of which have been mentioned in connection with cassava chip damage and related experiments under controlled conditions (see section 3). Table 24 summarises the insect species found during the loss-assessment studies and their abundance as a percentage of the total amount of insects.
Table 24: Insect species found during the farm and station loss-assessment studies 1995 and the frequency of beetles (%) related to the total amount of insects
|
Family |
Species |
|
Author |
Status |
Frequency in % |
|
Anthribidae |
Araecerus |
fasciculatus |
(Degeer) |
primary storage pest |
* |
|
Bostrichidae |
Dinoderus |
minutus |
Fabricius) |
primary storage pest |
79 |
|
Rhyzopertha |
dominica |
Fabricius) |
primary storage pest |
6 |
|
|
Heterobostrychus |
brunneus |
(Murray) |
storage and material pest |
0.2 |
|
|
Sinoxylon |
sp. |
|
Material pest |
0.08 |
|
|
Cleridae |
Thaneroclerus |
buqueti |
(Lefevre) |
predator |
* |
|
Curculionidae |
Sitophilus |
zeamais |
(Motschulsky) |
Primary storage pest |
10 |
|
Ostomidae |
Tenebroides |
mauritanicus |
(Linnaeus) |
primary storage pest and predator |
0.5 |
|
Silvanidae |
Oryzaephilus |
surinamensis |
(Linnaeus) |
primary storage pest |
|
|
Tenebrionidae |
Palorus |
sp. |
|
storage pest |
2 |
|
Tribolium |
confusum |
(Jaquelin du Val) |
secondary storage pest and predator |
|
|
|
Tribolium |
castaneum |
(Herbst) |
secondary storage pest and predator |
2.5 |
|
|
Reduviidae |
Reduvius |
sp. |
|
Predator |
* |
* neglible in frequency
Description of different insect species found during the field trials in Ghana
Pests which cause the greatest damage to the chips belong to the Bostrichidae family, whose members are characterised by the presence of powerful mandibles with which they can cut directly into wood and other vegetable material (Adesuyi, 1975). Other insects mentioned below seem to cause no serious threat to chips, i.e. Araecerus fasciculatus (Degeer) of the family Anthribidae, a large family of beetles most of which feed on dead wood and fungi. Only one species, A. fasciculatus, is of economic importance to stored products and is found in most tropical and subtropical regions; it can severely damage dried cassava (Parker and Booth, 1979). The optimum development takes place at 28°C and 70 % r.h.; lower humidities severely reduce the development rate.
Clerids are also found in neglible numbers and do not appear to cause a great threat to dried chips in the Northern Region of Ghana. Clerids are mainly tropical beetles, and the few species found in stores are about 4 - 7 mm long. They are mostly predators, and Thaneroclerus buqueti (Lefèvre) is often associated with infestations of anobiid beetles such as Lasioderma serricorne, Stegobium paniceum and Anobium punctatum (Haines, 1991).
The only trogossitid to occur frequently in stored products is Tenebroides mauritanicus (Linnaeus). The adult is 5 -11 mm long and black in colour. It has a cosmopolitan distribution, and it is well known as a minor pest of stored products such as cassava and as a predator of other insects (Haines, 1991).
Most of the beetles of the family Silvanidae occur on plants or among plant materials; several species are wood-boring beetles. Adults are about 2.5 - 3.5 mm long and dark-brown. Oryzaephilus surinamensis (Linnaeus) is a common secondary pest of cereals and cereal products. Adults and larvae are able to enter small cracks (Haines, 1991). The beetle is also able to develop on cassava (Pöschko, 1993), but in our studies the beetle was found in neglible numbers and caused no severe damage to dried chips.
As already outlined in section 3, the Tenebrionidae are common throughout the temperate and tropical regions of the world. Most of them are secondary pests. Palorus sp., Tribolium confusum (Jacquelin du Val) and Tribolium castaneum (Herbst) are associated with stored commodities, very few are well-adapted to the dry environment that characterises well-stored durable foodstuffs. Infestation by Tenebrionid beetles leads to disagreeable odour in the commodity, due to the secretion of benzoquinones from a pair of abdominal defence glans, present in all species studied (Haines, 1991). T. castaneum was found more frequently than T. confusum during the loss-assessment study; it amounted to 2.5% of the total amount of insects but caused no severe damage to dried chips. Palorus sp. are more tolerant of low humidities and develop in a wider range of temperatures. Palorus sp. amounted to about 2% of the total insect population but also caused no serious threat to dried chips.
Sitophilus oryzae (Linnaeus) and Sitophilus zeamais (Motschulsky) are the most common and most destructive pests in the world and both have the characteristic rostrum and elbowed antennae of the Curculionidae family. S. zeamais is predominantly found on maize but also on milled rice and cereals, and seems to be able to breed on dried cassava. Both species are capable of flight. The female bores holes in the surface layers of grains either in the field or in store; in each hole she deposits a single egg and then plugs the hole with a hard secretion (Haines, 1991). S. zeamais amounted to 10% of the total insects and especially in the trials at the station, with 396 beetles compared to 45 beetles in the farm studies in the eighth months of storage. This was mainly due to a nearby large grain storage facility from which the species seemed to migrate to the cassava storage facilities. The weight losses on-station increased from the sixth month onwards, from 6.5% to about 13.6% in the seventh month and 21.3% in the eighth month of storage. This increase in weight losses was also due to the infestation with D. minutus.
Sinoxylon sp. (Duftschmid) and Heterobostrychus brunneus (Murray), two other species of Bostrichidae (see section 3.1.3.1.), were found only in some stores in low quantities and amounted to about 0.2 to 0.08%; but these insects seem to be quite destructive. The wood-boring activities of these beetles can weaken storage structures and provide hiding places for residual pest populations. These are known as material pests found commonly on wood: H. brunneus is 7 -13 mm long and has also been found in coffee beans, cassava and potatoes but mainly lives in wood; and Sinoxylon sp. (Gerstacker) is found in wood (Casuarina, Acacia, Albizzia) or other organic material. There is rarely evidence in the literature that they thrive on cassava chips although the beetles appear to be common on cassava in East Africa (Frappa, 1938; Lepesme, 1944; Mangoendihardjo, 1981; Dobie et al., 1991 and Delobel, 1992).
The most numerous insect species in both farm and station studies are D. minutus, S. zeamais and R. dominica which amounted to 79%, 10% and 6%, respectively, of the total insects found during the studies. In both surveys, the Wood Borer D. minutus accounted for about 74 - 83% of the total insects found in the samples between the second and eighth month of storage. In the station trials, this number dropped to 53% in the eighth month and the maize weevil Sitophilus zeamais increased in number from 10% in the sixth month to about 42% in the eighth month.
Storage at field level is a dynamic system involving continual dislocation of the stored produce, in which there is a changing insect population. During the farm study, the total number of D. minutus decreased slightly from 90% to 83% whereas the number of R. dominica beetles increased from 3% to 16% in the eighth month of storage. The monthly weight losses increased from 0.2% to about 8% on the farm.
In the station, the number of D. minutus beetles dropped from 94% to 53% in the eighth month and the maize weevil S. zeamais increased in number from 0.7% in the third month of storage to about 42% by the end of the storage season. Weight losses increased from 0.3% to about 21.3%.
The mixed infestation pressures of D. minutus and S. zeamais at the station and D. minutus and R. dominica on the farm increased towards the end of the storage season. It seems, especially in the station study, that S. zeamais becomes the dominant competitor for food and space in the long term. These results fall in line with findings from Giga and Canhao (1993) and experiments of population dynamics under controlled conditions. It was observed in laboratory experiments with P. truncatus and S. zeamais that the maize weevil was a strong competitor for P. truncatus and would be the dominant species in the long term depending on climatic conditions and mode of presentation of food. It was further noted, however, that in some cases only small numbers of Sinoxylon sp. (Duftschmid) or Heterobostrychus brunneus (Murray) caused the complete weight loss of the stored cassava produce under field conditions. Thus, establishing relationships of weight-losses to numbers-of-insects for the field studies in Ghana are difficult because of intra- and interspecific competition of pest populations.
Initial infestation of chips with insects during the drying process and at the beginning of the storage period was low. Figure 49 shows that the numbers of insects found in the samples increased considerably as the chips absorbed moisture after the onset of the rains, in the second and third months of storage.
The total number of insects found in the respective structures and samples on-station were, at 105 per sample, about 65% higher than in the on-farm samples that had 68 per sample by the end of the storage period (see Tables 25 and 26). In all, the mean number of insects per chip was much higher in the station study (six insects/chip) than in the farm study (three insects/chip).
Figure 47: Development of insects per sample during the farm - and station loss-assessment study 1995, 8-month storage period (n = 30 structures)
Table 25: Pest population dynamics over an 8-month storage period related to weight losses, farm study 1995
|
weeks in storage |
number of structures (n) |
GM |
mean number of insects/sample |
mean number of insects/chip |
|
0 |
21 |
0 |
0 |
- |
|
1 |
21 |
0.0 |
0 |
- |
|
2 |
21 |
0.2 |
10.0 |
1.3 |
|
3 |
21 |
0.9 |
40.7 |
2.7 |
|
4 |
21 |
1.9 |
37.9 |
2.6 |
|
5 |
21 |
3.7 |
34.8 |
2.1 |
|
6 |
19 |
4.6 |
63.1 |
2.8 |
|
7 |
16 |
7.3 |
69.8 |
2.5 |
|
8 |
5 |
8.0 |
68.2 |
3.4 |
Table 26: Pest population dynamics over an 8-month storage period and related to weight losses, station study 1995
|
weeks in storage |
number of structures (n) |
GM |
mean number of insects/sample |
mean number of insects/chip |
|
0 |
9 |
0 |
0 |
- |
|
1 |
9 |
0 |
0 |
- |
|
2 |
9 |
0.3 |
12.8 |
1.3 |
|
3 |
9 |
0.8 |
32.9 |
2.2 |
|
4 |
9 |
1.8 |
62.8 |
4.2 |
|
5 |
9 |
4.7 |
74.1 |
4.0 |
|
6 |
9 |
6.6 |
93.2 |
4.7 |
|
7 |
9 |
13.6 |
98.9 |
4.9 |
|
8 |
9 |
21.3 |
105.1 |
6.0 |
Cumulative losses mainly due to insects were calculated by applying the weight losses in the sample to the quantity of food removed from the store each week or month. This value was then used to calculate the quantity of chips that had been lost since the previous removal. The quantity lost, together with the amount removed by the farm family, was then expressed as a percentage of the original content of the store. The calculations for quantity of cassava chips stored and removed were based on our multiple visits to the farmers involved in the on-farm loss-assessment study and on the findings from the general questionnaire in 1994 (MOFA-GTZ). The majority of farmers, about 71%, removed chips once weekly; 14% removed them twice and 14% thrice weekly, depending on family size and amount stored. The amount removed was about one 20 - 25 kg pan for 91% of farmers, and about 5% of the farmers removed two 2 pans (40-50 kg) per week. The majority of farmers, or 75%, stored about 22 - 23 sacks (one sack weighing about 65 kg) of chips. All calculations in Tables 27 and 28 were based on the assumption that m. c. of the quantity of chips stored is changeless over time.
The results of the farm survey indicate that weight losses at farm level are probably lower than previously thought. Losses at the end of the storage season were about 8%. The variety, storage method and management, and the gradual decrease in the quantity of stored produce have a large impact on the final loss figure. Taking into account the reduction of stocks throughout the season, the total weight losses were about 2.5% at the end of the storage season (see Figure 48 and Table 27).
The weight losses were much higher in the station stores than in the field stores, and weight losses from the on-station produce were about 21% by the end of the storage season. Taking into account the removals from the stores; however the total weight losses were about 5.3% (see Figure 49 and Table 28).
Table 27: Comparison of cumulative weight losses with weight losses % over a storage period of 8 months, farm study, 1995
|
months in store |
storage structures |
stored produce in kg |
removal of chips in kg |
monthly weight losses in % |
cumulative weight losses in % and kg | |
|
0 |
21 |
31980 |
0 |
0 |
0 |
0 |
|
1 |
21 |
|
5499 |
0.0 |
0.02 |
1 |
|
2 |
21 |
|
4990 |
0.2 |
0.03 |
10 |
|
3 |
21 |
|
4955 |
0.9 |
0.2 |
45 |
|
4 |
21 |
|
4562 |
1.9 |
0.3 |
87 |
|
5 |
21 |
|
4334 |
3.7 |
0.5 |
160 |
|
6 |
19 |
|
2862 |
4.6 |
0.4 |
132 |
|
7 |
16 |
|
2466 |
7.3 |
0.6 |
180 |
|
8 |
5 |
776 |
1536 |
8.0 |
0.4 |
123 |
|
Total loss |
2.45% 738 kg | |||||
Table 28: Comparison of monthly cumulative losses with weight losses % over a storage period of 8 months, station study, 1995
|
months in store |
storage structures |
stored produce in kg |
removal of chips in kg |
monthly weight losses in % |
cumulative weight losses in % and kg | |
|
0 |
9 |
9624 |
0 |
0 |
0 |
0 |
|
1 |
9 |
|
1200 |
0 |
0 |
0 |
|
2 |
9 |
|
1197 |
0.3 |
0.0 |
4 |
|
3 |
9 |
|
1190 |
0.8 |
0.1 |
10 |
|
4 |
9 |
|
1178 |
1.8 |
0.2 |
21 |
|
5 |
9 |
|
1144 |
4.7 |
0.6 |
54 |
|
6 |
9 |
|
1122 |
6.5 |
0.8 |
73 |
|
7 |
9 |
|
1038 |
13.5 |
1.5 |
140 |
|
8 |
9 |
611 |
944 |
21.3 |
2.1 |
201 |
|
Total loss |
5.33% 503 kg | |||||
Figure 48: Comparison of cumulative real weight losses and weight losses, farm study 1995 (n = 21 storage structures)

Figure 49: Comparison of cumulative weight losses and weight losses, station study 1995, (n = 9 storage structures)
The HCN content of the cassava chips decreased by about 44%, from 127.08 mg/kg at the beginning to about 71.2 mg/kg by the end of the storage season. These figures are means for all varieties and indicate the general tendency of decreasing HCN. The standard deviation was neglible at 0.2.
The starch content of the chips decreased by only 0.4% during the storage sea son, from 78.6% at the beginning in February to about 78.2% by the end in October, 1995. These figures are means for all varieties, but the starch contents of each variety were quite similar. These results confirm the findings in the analysis under controlled conditions and indicate that insects cause more physical destruction and weight loss of the chip than qualitative loss.
Cassava chips absorb moisture rapidly from humid environments and reach an equilibrium moisture content. At 30° C and 70% r.h., chips have a moisture content of about 15%, which is the acceptable upper limit for safe storage (Anon. 1952; Anon. 1965). During the 1995 storage season, the moisture content increased from 8 - 9% at the beginning in February to about 14 -16% at the end in October.
Weight losses in dried chips have to be viewed with a wider perspective and not just seen as a mere quantitative exercise. For a complete picture of the post-harvest situation and a careful evaluation of the storage systems aspects must be considered such as perceptions of the farmers, socio-economic importance of cassava and profitability of the subsistence crop. The participatory appraisal method and the incorporation of the farmers' views on storage management and estimations of weight losses in chips help to provide this overview of a situation. Loss figures are usually only estimates, but at the same time the perception of the producer is considered while no serious efforts have been made to quantify economic losses involved in chip storage, economic evaluation of the current postharvest situation is important to appraise improvements and to indicate critical thresholds, i.e. for the application of pesticides. Farmers seem to be more receptive to recommendations for chip storage if they gain access to markets and this attach an economic value to the produce (Bell and Mück, 1997).
Perception of weight losses during cassava chip storage
When evaluating the weight losses in the farm survey, it is very important to relate the abstract weight loss figures to the farmers' estimations. Farmers perceived their total losses much higher than the loss figures calculated in 1995 and felt that they lose on the average 9 -15% of their stored produce compared to 2 - 3% estimated by quantitative measurements. The majority of the 21 farmers (95.3%) felt their general losses were between 5 - 20%. Only 4.3% of the farmers thought the weight losses were beyond 20%. In general, most of the farmers classified their losses as medium-severe to severe, especially towards the end of the storage period. The investigation of the relationships between the two variables, perception of losses by farmers and weight losses assessed by the GM, revealed that these two variables do not closely correlate (r = 0.3).
The estimation of losses as given by farmers underlines the importance of cassava chips as a security crop; farm-families depend for their survival on a sufficient amount stored insect-free in the lean season to bridge the gap until the next harvest. Because interviews with farmers were mainly carried out in the lean season and towards the end of the storage season, when farmers might have perceived chip losses much higher than actual and other stored agricultural products might have been insufficent, they may have expected assistance from the project and exacerbated the situation. Therefore, it is important to assist the farmers in their needs, but it is also necessary to consider the situation environment of the farm-household.
Farmers' economic behaviour in developing countries frequently differs from that in developed countries. The fragile and complex environment is one reason for their awareness of risk and their uncertainty regarding agricultural production and storage of subsistence and cash crops, and their resulting decisions affect their survival in this environment. The cultural, social and economic factors affecting those involved should be considered when estimating losses, because they may complement and contribute to an understanding of the more academic exercises of assessing losses (Harris and Lindblad, 1978). The farm-household can be studied as an economic unit, a social group, a product of historical development or a consumption unit. Hence, the discussion has to stress the heterogeneity of peasant farming in terms of the technical, economic and especially social and cultural environment. Farmers have many priorities, of which a sufficient food level for the farm-household is the highest; so, it is also important to attribute value to the stored cassava chips for an assessment of financial losses during their storage. The following section deals with the economic assessment of stored dried cassava chips (Stumpf 1989).
The quantity as dried chips is estimated at 0.6% to 1% produced of the total harvested cassava crop in Ghana (see Table 29). In the Northern Region, cassava chips are a semi-commercialised good and statistics are rarely available on the quantity of fresh cassava transformed into different products, especially dried cassava chips. Al-Hassan (1994) noted that in the Northern Region and the areas of Salaga and Yendi, about 60 -100% of the harvested cassava is transformed into chips.
Table 29: National utilisation (%) of fresh cassava in Ghana (TechnoServe, Ghana, 1994)
|
Subsistence of farm-household |
gari |
kokonte |
agbelima |
chips |
sale to traders |
Surplus |
|
30 |
12.4 |
1 |
10 |
0.6 |
42 |
4 |
Source: TechnoServe, Ghana, 1994
Price study
Price information on producer, retail and wholesale levels is available from the Department for Policy Planning, Monitoring and Evaluation (PPMED). The producer prices are estimated to be 60 - 75% of the wholesale prices. The figures in Table 30 are a compilation of data generated during the multiple visits to the farmers involved in the farm study and data from the PPMED for 1995. Analysis of the data revealed that producer prices are more or less stable and that cassava is available between the very beginning of the harvest in December until June, when selling activities are reduced as the stored products dwindle. The wholesale and retail prices were relatively high at the very beginning of the storage season in January and February, 1995, after which they dropped and rose again towards the end of the storage season, from August onwards.
The calculation of 1995 wholesale prices was based on Cedis and one kg chip. The conversion of Cedis into DM for the wholesale prices was based on the January, 1995 conversion rate and revealed price increases towards the end of the storage season. But the high inflation rate prevailing in Ghana (nearly 60% for 1995) indicated no real price increases: the wholesale price for 1 kg chip in December was about 0.28 DM based on the exchange rates of January, 1995, but in reality the figures are 0.19 DM/1 kg chips (see Table 30 and Annex II).
Table 30: Producer, retail and wholesale prices in Cedis and DM per kg dried cassava-chips (1 DM = 674 Cedis in January 1995)
|
month |
producer price in Cedis/1 kg |
retail price in Cedis/1 kg |
wholesale price in Cedis/1 kg |
wholesale price in DM/1 kg |
|
January |
- |
- |
153.0 |
0.23 |
|
February |
87.3 |
91.2 |
116.0 |
0.17 |
|
March |
91.2 |
73.5 |
106.0 |
0.16 |
|
April |
86.4 |
61.0 |
117.3 |
0.17 |
|
May |
91.0 |
77.5 |
131.8 |
0.17 |
|
June |
89.2 |
79.0 |
100.3 |
0.15 |
|
July |
91.7 |
77.8 |
104.2 |
0.15 |
|
August |
90.3 |
106.2 |
120.4 |
0.18 |
|
September |
- |
146.9 |
109.2 |
0.16 |
|
October |
- |
160.2 |
143.5 |
0.21 |
|
November |
- |
- |
172.0 |
0.26 |
|
December |
- |
- |
187.0 |
0.28 |
- = no data available. Source: PPMED and Barclays Bank, Ghana, 1995
Economic calculations on drying, storing and selling of chips
The economic assessment of storing and selling of dried cassava chips is quite difficult, because farmers cannot specify all costs involved for activities or inputs. Calculation of costs for labour, drying and construction of storage structures is usually done on a non-monetary basis. The farmer relies on the help of friends or community for labour and in obtaining the necessary materials from the nearby surroundings. Farmers sell their produce when there is need for cash to meet with family obligations, though they are not in a position to bargain or to access market information to obtain an optimal price. In addition, small-scale farmers rarely dealt with banks or applied for credit.
The following Tables 31 and 32 present economic calculations for drying and storing cassava chips as well as the gross margins upon sale. All calculations are based on the average storing capacity of 23 bags of chips for a farmer in the Northern Region and on the assumption that a moisture content increase in stored chips does not take place. Standardisation of bags or basins is not common in the study area; cassava chips were sold in all sorts of basins on a volume base, and it is quite common for the average bag to differ widely in capacities depending on the bag filling capacity. Because of these differences, a bag could weigh between 65 and 95 kg. Our estimation of one bag was about 65 kg compared with PPMED of 59 kg.
In Table 31, the gross return (1) is calculated to be 130514 Cedis (about 194 DM) in February for 23 bags of dried cassava chips sold immediately after drying. The producer prices varied from 60 to 85% of the wholesale price throughout the storage season and also depended on the bargaining position of the farmer. Drying costs (2) were based on the assumption that the local drying structure was used for drying for about two months and subsequently used for drying other agricultural commodities for the rest of the year. The life of the Leenga structure was estimated by farmers to be four years and cost about 16000 Cedis (sd 6235). Interest rates (3) were calculated at a rate of 27% p.a. (Barclays Bank, Ghana) for the costs of the drying structure.
Table 31: Economic calculations in Cedis for the drying and selling of 23 bags dried cassava chips, farm study 1995 (1 DM = 674 Cedis in January 1995)
|
|
Drying Structure Leenga |
|
(1) Gross return for 23 bags of chips in February |
130514 |
|
|
(DM 194) |
|
- (2) depreciation |
667 |
|
- (3) interest p.a. |
720 |
|
- maintenance |
200 |
|
Total variable costs |
1587 |
|
Gross margin in February |
128927 |
|
|
(DM 191) |
If the farmer decides to store the dried cassava chips for about six months the gross margin varies depending on the type of storage structure (see Table 32). In all cases, the storage structure was estimated to be used for cassava chip storage about six months and then used for other commodities the rest of the year (4). Hence, the costs are applicable for only this limited period. The traditional Kanbon was estimated by farmers to have a durability of four years and total costs of 39250 (sd 13110) Cedis. The improved version of the Kanbon was also estimated to be in use four years, and the construction costs were about 25629 Cedis (sd 17270). The Napogu was estimated to cost about 32150 Cedis (sd 10362) and had a durability of nine years. Maintenance costs (5) were estimated at about 1500 Cedis for six months. The physical loss (6) was assessed to be about 4.6% and about 69 kg for August 1995, compared to the total stored produce of 1495 kg. This is a financial loss of about 8098 Cedis based on replacement costs at the market.
Interest rates (7) were calculated at a rate of 27% p.a. (Barclays Bank Ghana, 1995) for the costs of the different storage structures, maintenance and return on chip sales for six months.
The gross return (8) of 135148 Cedis was based on the producer price of about 90 Cedis per kg dried chips in August, 1995, which was about 75% of the wholesale price of about 120 Cedis. The Gross Margin (9) received after six months of storage was between 100578 (149 DM) and 104114 Cedis (155 DM), depending on the storage structure.
Table 32: Economic calculations in Cedis for 6-month storage and sale of 23 bags dried cassava-chips in different storage structures, farm study 1995 (1 DM = 674 Cedis in January 1995)
|
|
Storage Structures |
||
|
Traditional Kanbon |
Improved Kanbon |
Napogu |
|
|
Total drying costs in February |
1587 |
1587 |
1587 |
|
(4) depreciation |
4906 |
3204 |
1786 |
|
(5) maintenance |
1500 |
1500 |
1500 |
|
(6) physical loss in financial terms |
8098 |
8098 |
8098 |
|
(7) interest p.a. |
18484 |
18254 |
18063 |
|
Total variable costs |
34575 |
32643 |
31034 |
|
(8) Gross returns in August |
135148 |
135148 |
135148 |
|
|
(DM 201) |
|
|
|
(9) Gross margins in August |
100578 |
102505 |
104114 |
|
|
(DM 149) |
(DM 152) |
(DM 155) |
In summary, if the economic assessment is only based on gross returns without taking into account costs for storage structures or interest, the immediate sale of dried cassava chips in February, is less rewarding to the farmer than sale after six months of storage. The farmers often calculate using lower capital costs if any and nearly no operating costs. When costs for the storage structures, interest rates on the structure and sale were taken into account, the farmer received, after six months of storing cassava chips, about 24813 to 28354 Cedis less than the gross margin calculated in February, depending on the storage structure. If the farmer decides to store until December when producer prices increase, the financial returns improve (209674 Cedis = DM 311) compared to sales in August (see Table 32), but the high inflation rate and increasing physical losses make the long storage of chips until December solely for commercial reasons a risky business. Stores are usually depleted by October, and only in rare cases do farmers store until the next cassava harvest. Moreover, cassava chips are exposed to insects far longer and weight losses are likely to increase with prolonged storage. The weight and financial losses then appear to be significant for the farmer and the survival of the farm family. Chips that are lost during storage have to be replaced at much higher costs at the end of the storage season.
Based on the economic calculations for drying, storing and selling of chips, further calculations are possible i.e. a critical threshold for the application of pesticides to reduce weight losses. But, the critical loss limit for the individual farmer depends on various factors, such as family size, amount of stored chips, other subsistence crops available, and costs of replacing damaged chips, and thus it is difficult to determine an exact threshold level at which a farmer should start applying pesticides. In addition, farmers seem to be only prepared to invest in adequate post-harvest initiatives if an economic value is attached to chips and if marketing of chips is a valid option (Bell and Mück, 1997).
![]()
![]()
![]()